Using the HR Dashboard
The HR Dashboard offers valuable employee-related statistics, such as turnover, count of employees by department size, the number of employees currently onboarding or on probation, and much more. This information enables organisations to gain insights into the size and status of their staff.
Accessing the HR Dashboard
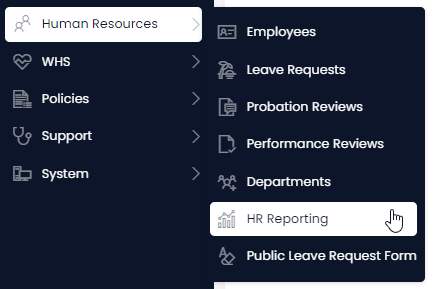
- On the Explorer sidebar click Human Resources > HR Reporting
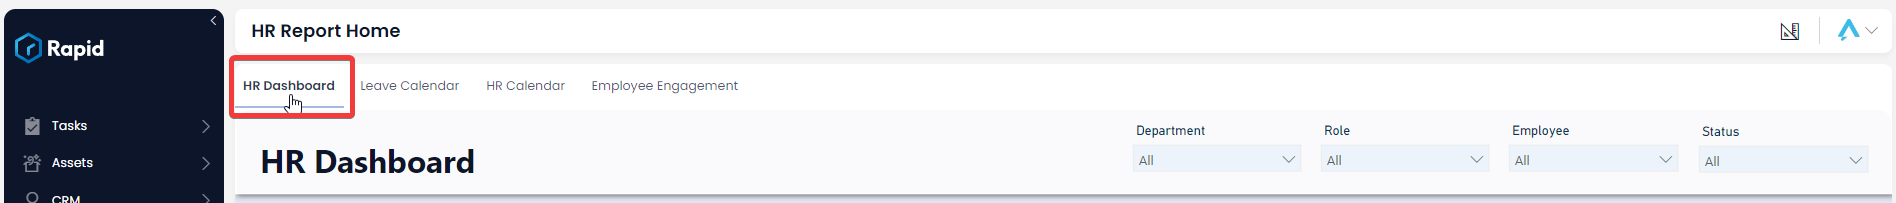
- Click on the HR Dashboard tab
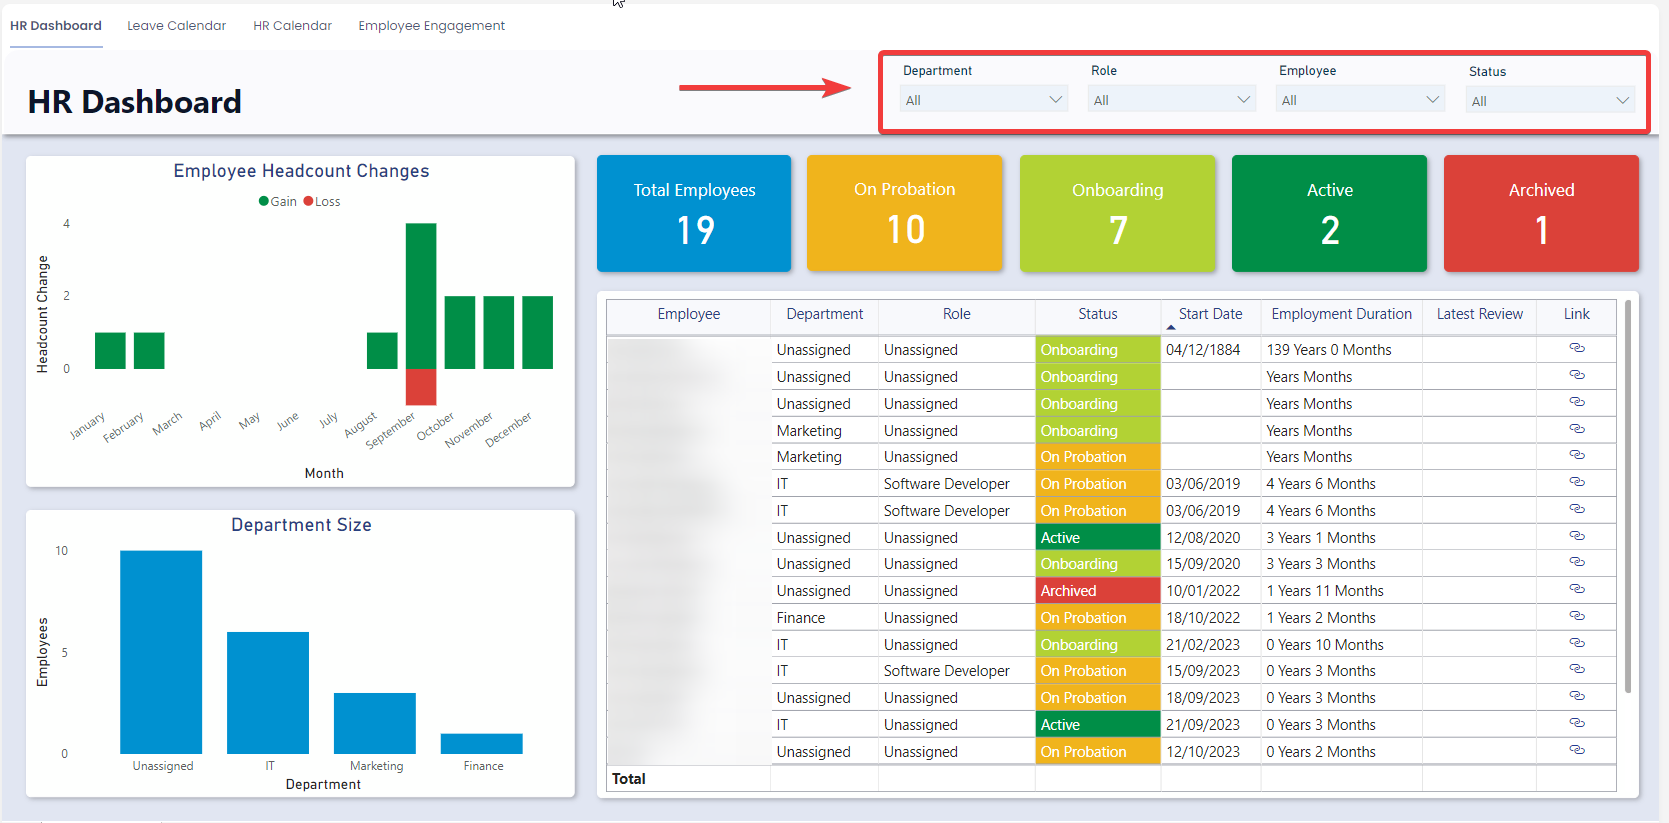
Slicers
Slicers provides the user with the ability to filter all the visuals on the page by a specific attribute, and can be found at the top of the page.
The HR Dashboard can be sliced based on no attributes, one attribute, or multiple attributes. The attributes available to “slice” by are Department, Role, Employee, and Status.
For example, you could use the slicers to filter down the visuals so that you can see "all Employees in the Sales Department that are On Probation".
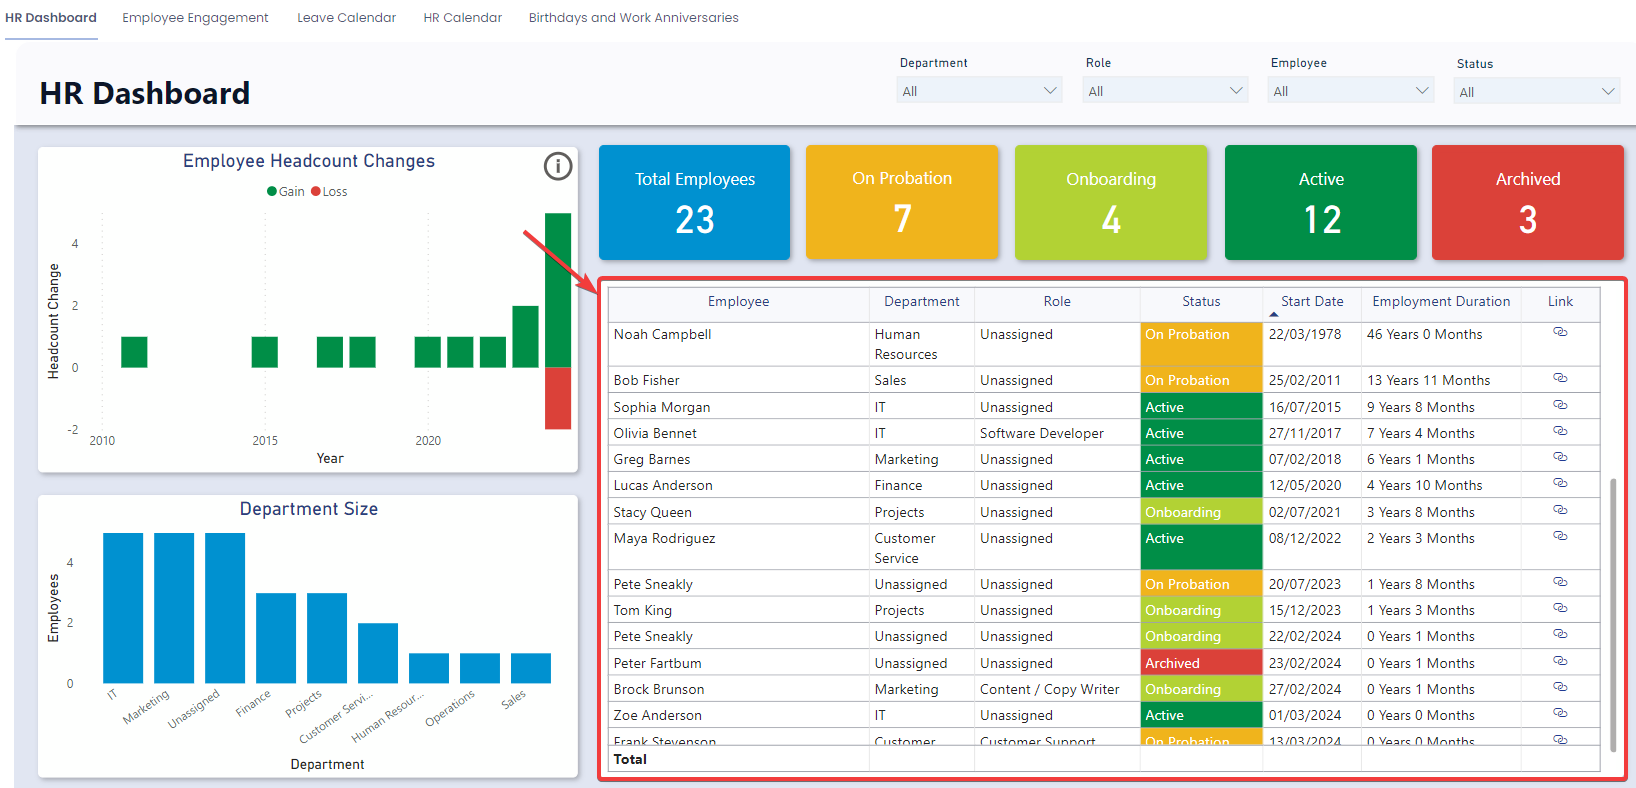
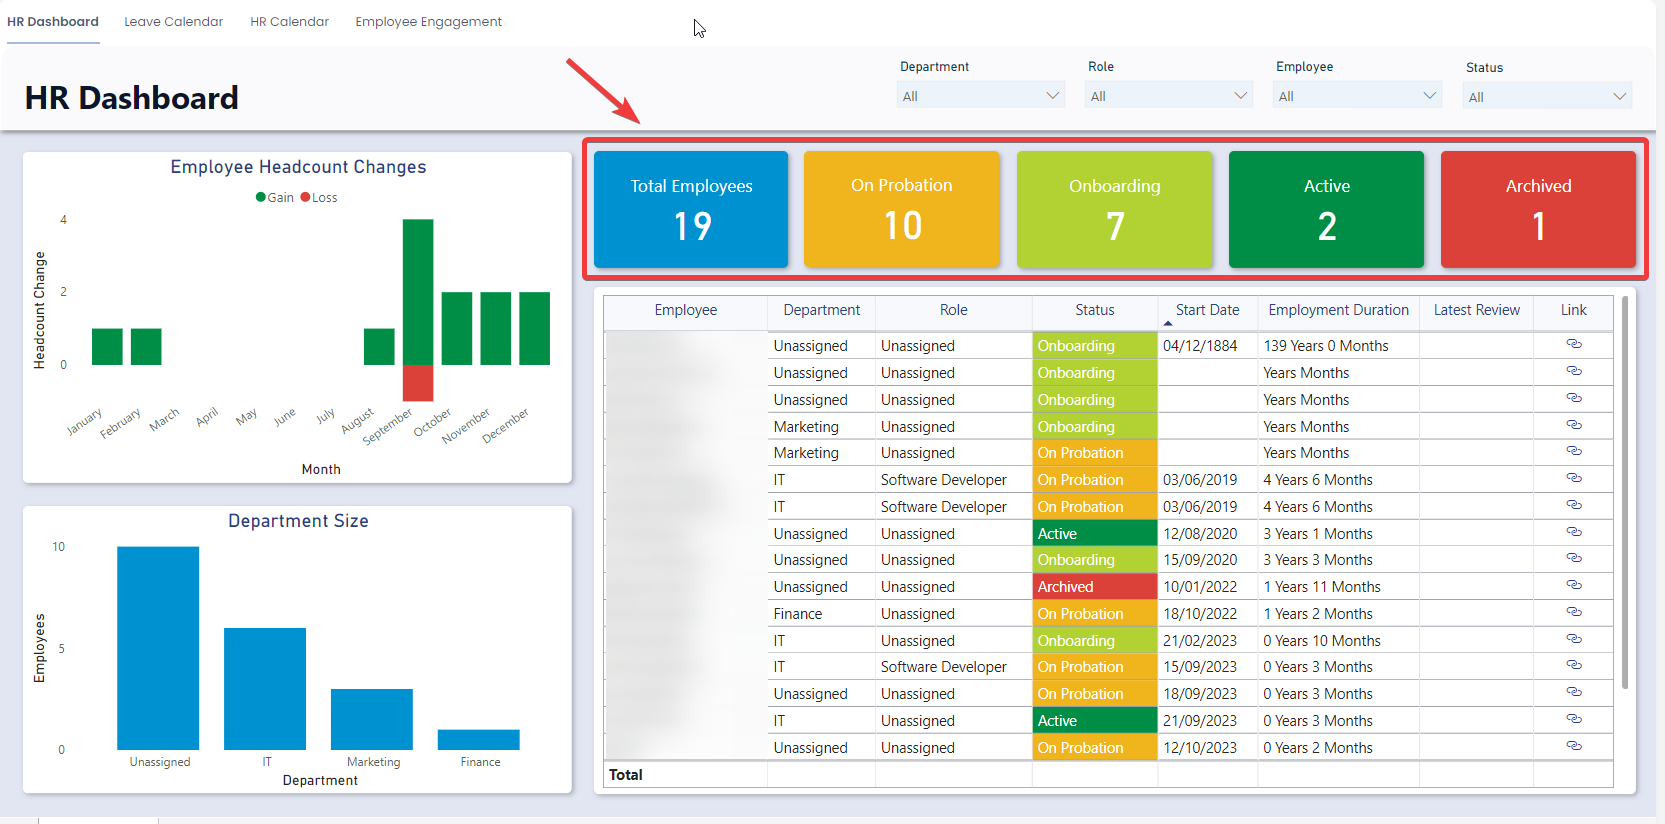
Cards
The Cards section within the HR Dashboard offers concise reference statistics. The values of these cards will change based on the slicers or if selections are made in the Employee Gain and Losses, Department Size, or Employee Table sections.
The provided cards are as follows:
- Departments – The sum of all active departments
- Employees – Total number of employees
- Active – Number of employees with a status of “Active”
- On Probation – Number of employees with a status of “On Probation”
- Onboarding – Number of employees with a status of “Onboarding”
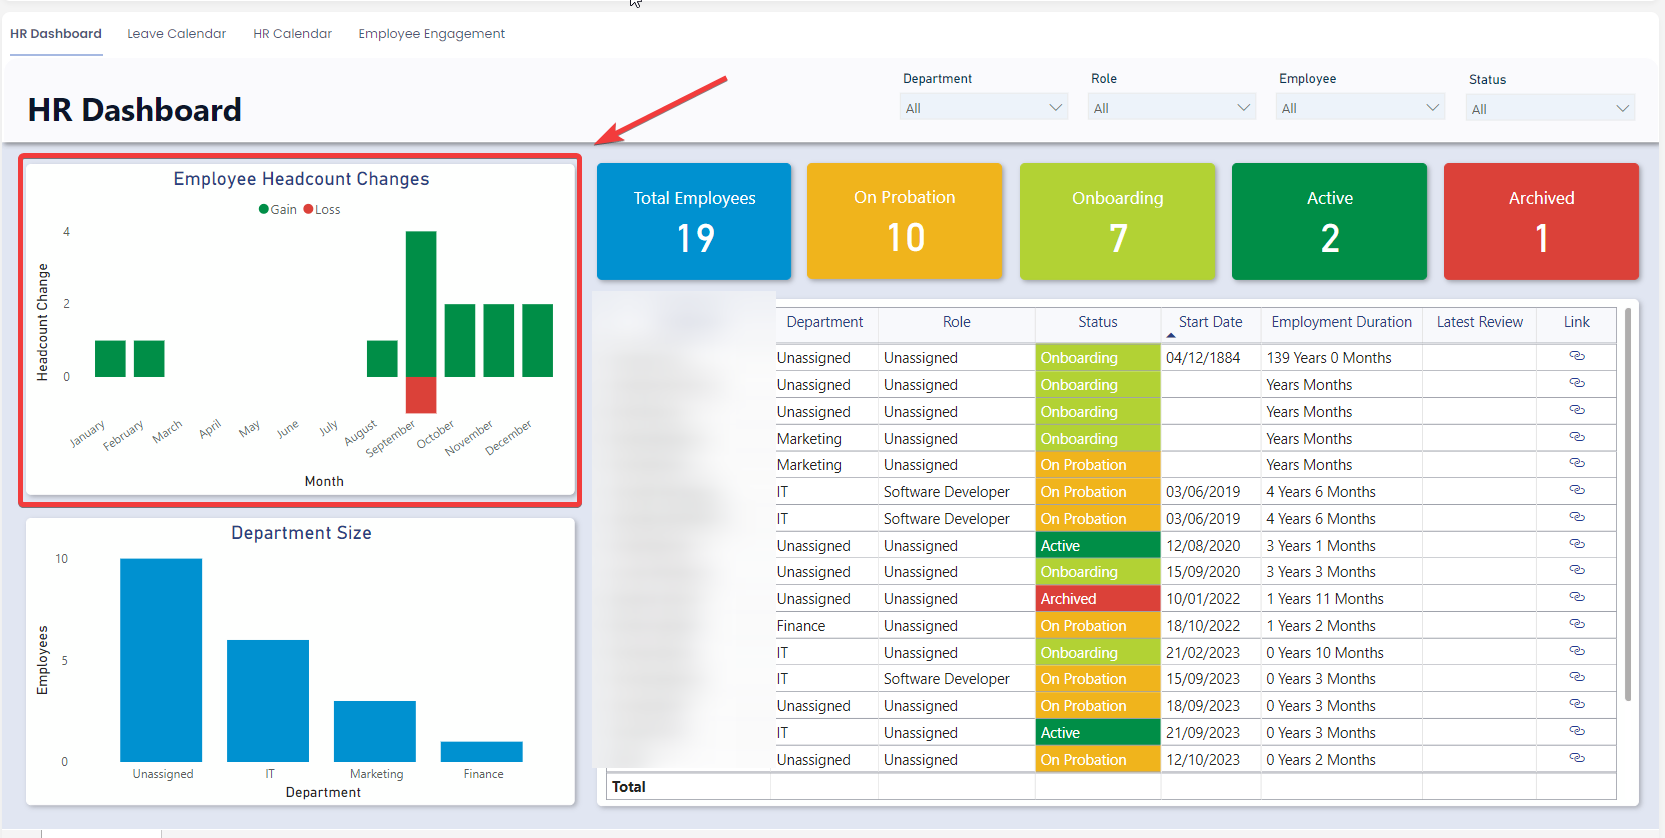
Employee Headcount Changes Visual
The "Employee Headcount Changes" graph displays the number of new hires and departures over time. This visual is interactive, meaning that clicking on a specific point on the graph will filter down all the other visuals to the data that relates to that specific time range. For example, clicking on the Employee Headcount Column above September will filter down the other visuals to the specific employees that make up that column.
It is also possible to change the unit of time from “Month” to “Year”. To do this simply click on the “Drill Up” arrow on the top right of the visual. To move back from the “Year” view to the “Month” view click on the “Drill Down” button and select the year you wish to drill down to.
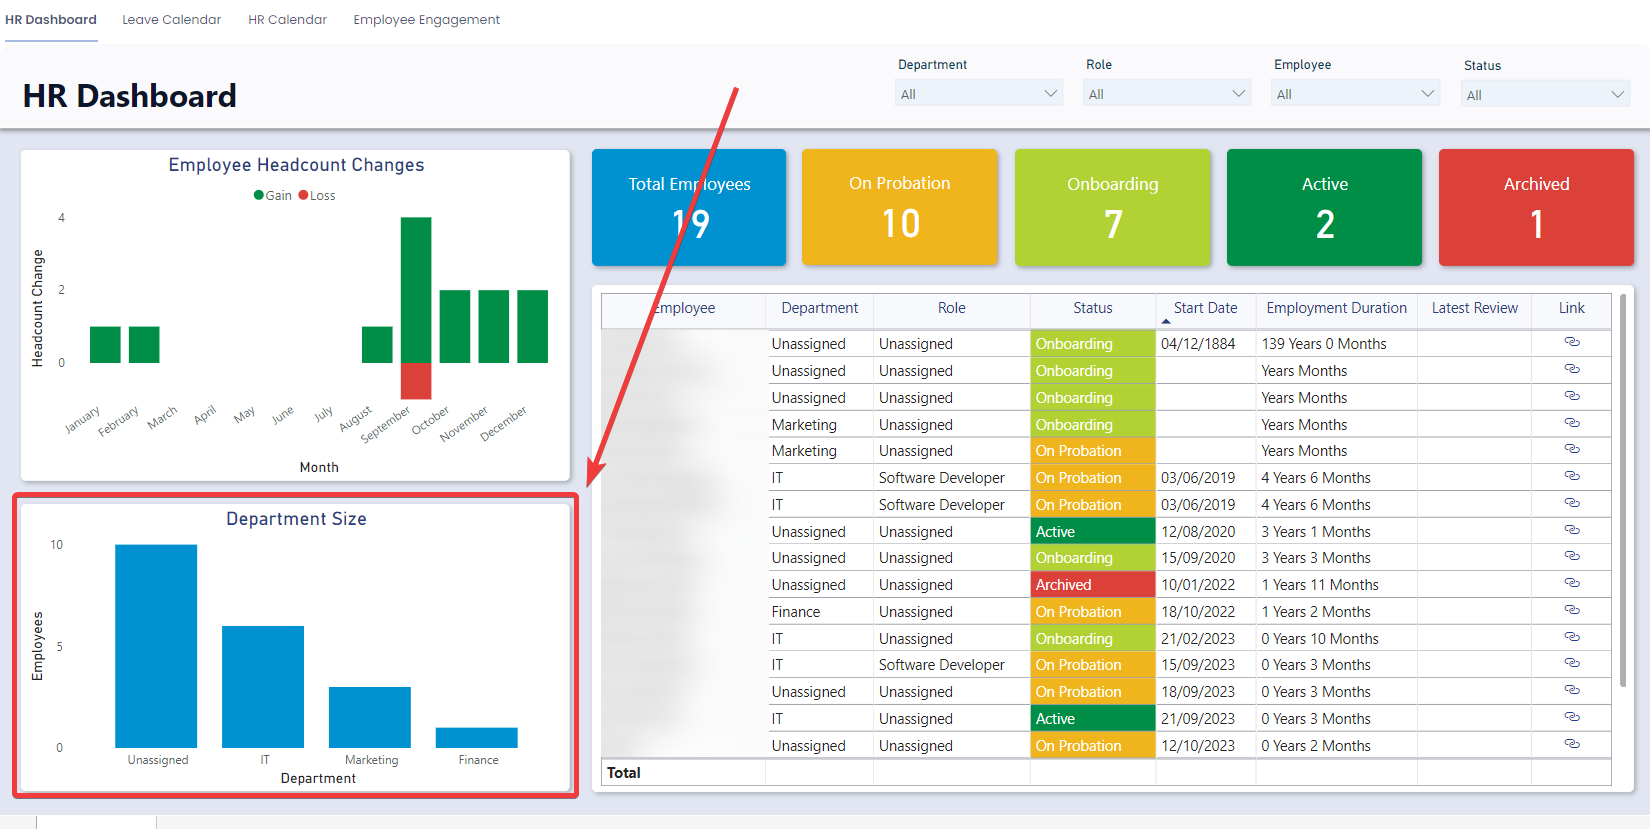
Department Size
The department size graph showcases various departments on the x-axis and the number of employees on the y-axis. This interactive visual allows users to click on department columns. This filters the other visuals in the HR Dashboard, and displays the employees within that specific department.
Employee Table
The Employee table has a row for each Employee along with relevant Human Resources columns. This is an interactive visual. Clicking on any of the rows will filter down the rest of the visuals to reveal information about this specific employee. The columns displayed on the table are: Employee Name, Department, Role, Status, Start Date, Employment Duration, and Link. Each of the columns are described in the table below.
| Column Title | Column Description | Example |
|---|---|---|
| Employee | The name of the employee | John Doe |
| Department | The employee's department | Sales |
| Role | The employee's job role | Software Developer |
| Status | The employee's status (Options: Onboarding, On Probation, Active, Archived). | Onboarding |
| Start Date | When they employee commenced work at the company. | 17/05/2018 |
| Employment Duration | The length of time the employee has been employed at the organisation. This is calculated by finding the difference between today's date and the employee's Start Date. | 2 Years 3 Months |
| Link | This provides a clickable link which will open the employee item. | NA |